The GGP has recently intergrated the Harmonized Histories Dataset within the GGP Data Collection and it is now available to all users The Harmonized Histories are a simplified dataset that covers partnership and fertility histories as well as some primary indicators. The dataset also includes data from the United States through the National Survey for Family Growth and we hope to add data from other countries in the near future. The dataset has been specifically adapted for use in event-history analysis and is therefore ideal for analysing the retrospective history elements of the GGP. It is aslo ideal for teaching event-history analysis as it is a smaller and simpler dataset than the full GGP dataset. The dataset was developed by the Non-Marital Childbearing Network and colleagues at Max-Planck and the GGP will continue to work with them to further develop this useful addition to the GGP data collection.
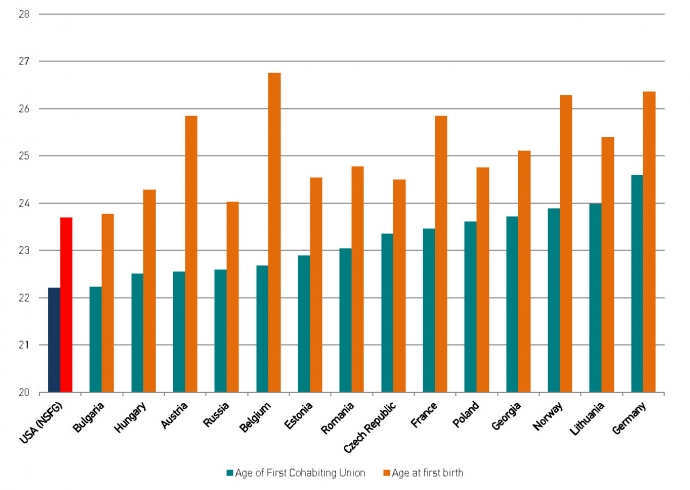
Age of First Cohabiting Union and First Birth

Source: Perelli-Harris, Brienna, Michaela Kreyenfeld, and Karolin Kubisch. Harmonized histories: manual for the preparation of comparative fertility and union histories. No. WP-2010-011. Max Planck Institute for Demographic Research, Rostock, Germany, 2010.
The GGP has recently intergrated the Harmonized Histories Dataset within the GGP Data Collection and it is now available to all users The Harmonized Histories are a simplified dataset that covers partnership and fertility histories as well as some primary indicators. The dataset also includes data from the United States through the National Survey for Family Growth and we hope to add data from other countries in the near future. The dataset has been specifically adapted for use in event-history analysis and is therefore ideal for analysing the retrospective history elements of the GGP. It is aslo ideal for teaching event-history analysis as it is a smaller and simpler dataset than the full GGP dataset. The dataset was developed by the Non-Marital Childbearing Network and colleagues at Max-Planck and the GGP will continue to work with them to further develop this useful addition to the GGP data collection.
Age of First Cohabiting Union and First Birth
Source: Perelli-Harris, Brienna, Michaela Kreyenfeld, and Karolin Kubisch. Harmonized histories: manual for the preparation of comparative fertility and union histories. No. WP-2010-011. Max Planck Institute for Demographic Research, Rostock, Germany, 2010.
Living apart together (LAT) relationships are when a couple are in a relationship but choose not to live together. They are an interesting topic of study because data on these relationships is hard to come by as they do not appear in residency or marital registries. Surveys like the Generations and Gender Survey (GGS) are therefore vital in studying how prevelant these types of relationships are, what type of people generally have them and whether they are similar to marriage and cohabitation. Indeed, data from the GGS has been used by several international research projects which have examined precisely these questions. The findings suggest that such relationships are in fact a sizeable minority and often allow couples to meet short term work and educational requirements. They are therefore most common amongst the highly educated and those who are still in education. LAT relationships at older ages are most common amongst those who have experienced divorce in a previous relationship and those wanting to maintain independence.
Percentage of Adults living in LAT relationships by Country
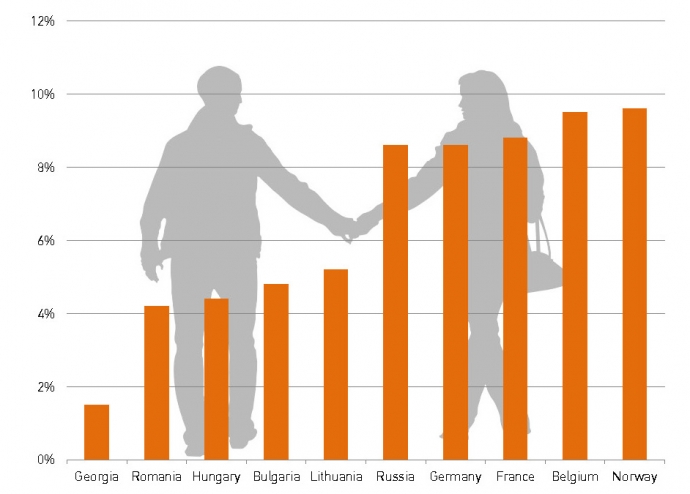
Source: The graphic contains data from Wave 1 of the Generations and Gender Survey and the following publication: Liefbroer, Aart C., Anne-Rigt Poortman, and Judith Seltzer. “Why do intimate partners live apart? Evidence on LAT relationships across Europe.” Demographic Research 32.8 (2015): 251-286.
This month saw the release of wave 2 data for the Czech Republic, extending the number of countries for which have wave 2 data is available to nine. There are a further three countries (Italy, Austria and Russia) for which the data are currently being harmonised which will help extend this to twelve. Data from wave 2 allows researchers to examine one of the most compelling aspects of the Generations and Gender Programme which is the study of life plans and their realisation. Throughout the GGP questionnaire there are a number of questions relating to individuals intentions over the next 3 years and data from wave 2 helps researchers examine whether these plans are realised. Existing research from the GGP has suggested that there are considerable differences in realisation rates across countries, across socio-economic status and across gender. Data from countries like the Czech Republic therefore helps us expand this exciting and insiteful area of research.
Since wave 1, did you realise your intention to….