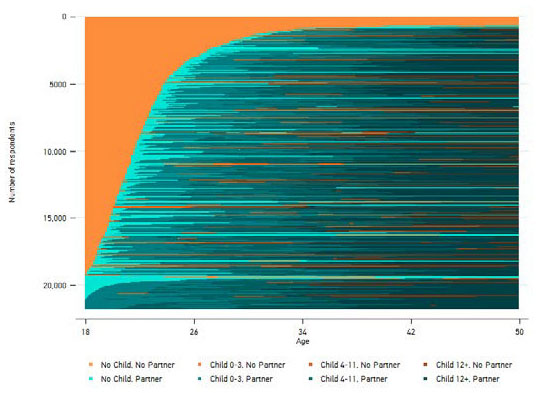
The GGP has very detailed information about individuals life histories and how their circumstances have changed over time. Below we have the life courses of 21,784 women aged 50-60 in 14 countries and how their family status has changed since they were 20 years old. Each line in the graph represents an individual’s life course and their change in status over a 30 year period. Some individuals, like those at the top of the graph, never have a partner and never have a child. Others have children with a partner but then seperate with them and raise the children alone. This image represents over 60,000 years in the life’s of our participants and researchers can then use the rich detail of this picture to examine the causes and consequences of our life stories and find patterns in this tapestry.
Family status of Women between the ages of 20-50 in 14 European Countries
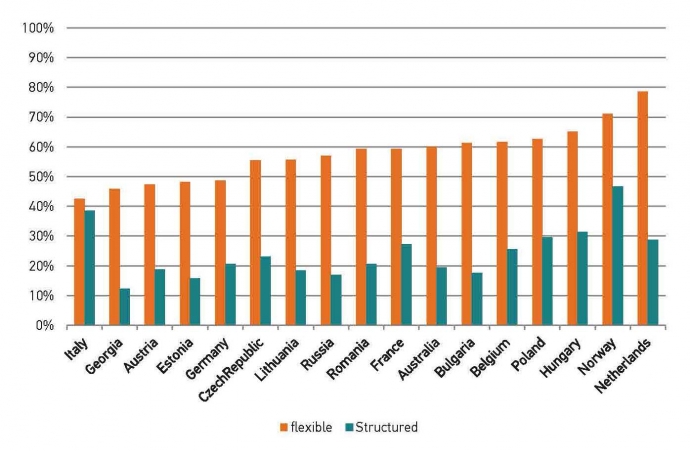
When Dads help with the childcare it can free up Mums to return to the labour market and continue their careers. However, analysis using GGP data shows that it’s also important to see what types of tasks Dads are helping out with. ‘Time Structured’ tasks like dressing and feeding children are more closely associated with a Mum’s return to work than more ‘Time Flexible’ tasks such a playing with the children or helping them with homework. Enabling fathers to be involved in such ‘Time Structured’ tasks is difficult to achieve however as they often clash with their own work schedule. This suggests that increasing father’s involvement in ‘Time Structured’ tasks may require bold policy innovations that help change well established practices. The analysis looked at fathers from 17 countries but was unable to find current policy arrangements or labour market indicators that supported father’s engagement in such tasks.
Proportion of fathers with children aged 0-2 participating at least equally in ‘Time Structured’ and ‘Time Flexible’ Childcare tasks in 17 Countries
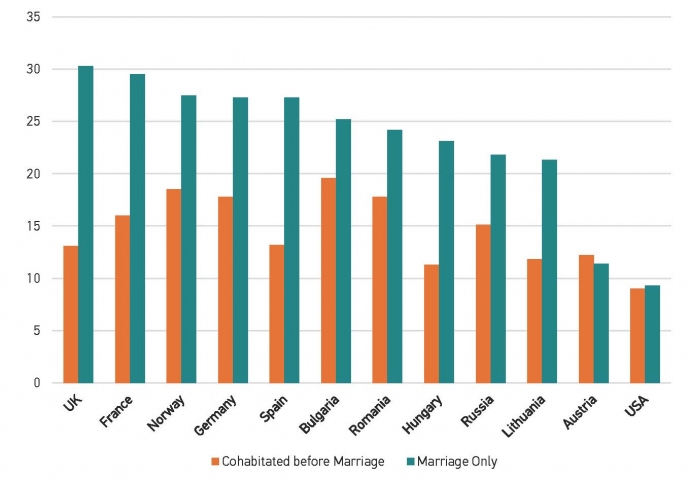
Couples living together before marriage has become increasingly common over the past few decades. This raises the question of whether marriages preceded by cohabitation are more or less stable and enduring as marriages in which the couple have not previously lived together. Some argue that cohabitation lessens people’s commitment to partnership and thus increases their risk of divorce, while others believe that a cohabitation phase before marriage (as a trial marriage) would strengthen marital stability. In the United States, data suggest that the effect of cohabitation on marriage is at best neutral; however, in European countries, the effect of cohabitation on marital stability varies markedly, according to a study covering the last decade of the twentieth century (Liefbroer and Dourleijn, 2006). Figure 1 indicates just how much union stability varies across countries for both those who have cohabited prior to marriage and those who have not. The GGS enables us to examine whether this pattern has changed over time or differs across groups within society.
Mean duration in years of heterosexual 21-79 year old individuals first union which was a cohabiting relationship followed by marriage or a marriage not preceded by cohabitation
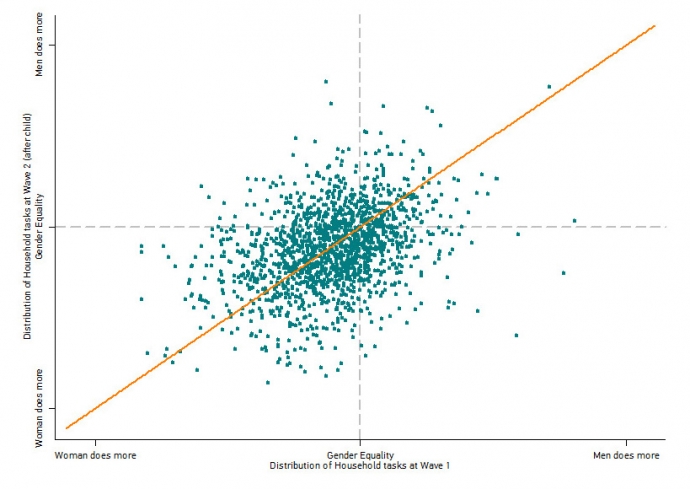
The GGP’s longitudinal design allows researchers to examine how relationships change over time and in response to people’s changing lives. For example, we can examine how the birth of a first child affects the distribution of household work (excluding childcare) within a couple. From the graph below we can see that the majority of couples are to the left of the graph, showing that women do more of the housework even before the arrival of children. At wave 2 these couples, who have all had a child, are primarily still below the gender equality line. The orange line in the graph represents the point at which the distribution of household tasks is the same before and after the arrival of child. Interestingly, there are a roughly equal number of couples on either side of the line. This means that for some couples the distribution of household tasks becomes more gender unequal where in others, it becomes more gender equal. The GGS allows us to probe further and examine what types of couples are in the first group and what type of couples are in the latter.
Distribution of Household Tasks before and after the birth of a couples first child
This month sees the release of the Wave 1 data for Sweden. The GGP now has publicly available data for 19 countries, allowing researchers to examine how lifecourses unfold in a wide variety of contexts. We know that families and lifecourses play out differently across countries but the GGP allows us to examine this in detail and its unprecendented breadth enables scientists to examine the role of contextual factors such as culture, policy and historical context. Figure 1 illustrates just how common coresiding with a parent is for young adults and when they start to move out in all 19 countries of the GGP. Such simple indicators raise questions as to why continued coresidence is common in places as diverse as Italy, Georgia and Japan, yet so uncommon in Scandinavia, Australia and France. The detailed micro level data of the GGP enables us to examine these cross national differences at the individual level.
Percentage of 20-35 year olds living with at least one parent
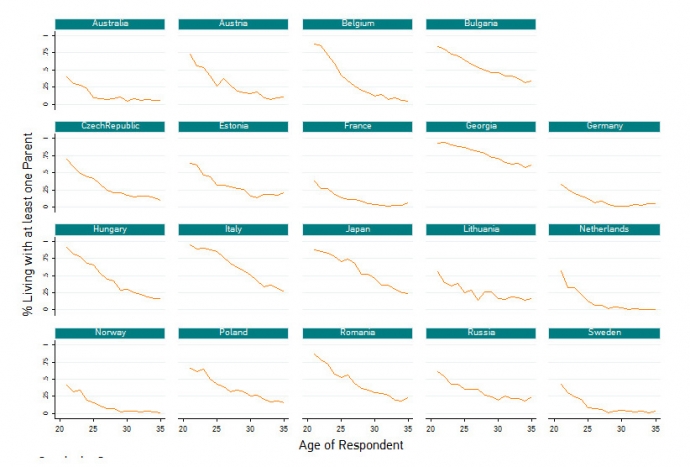
Source: Generations and Gender Survey Wave 1