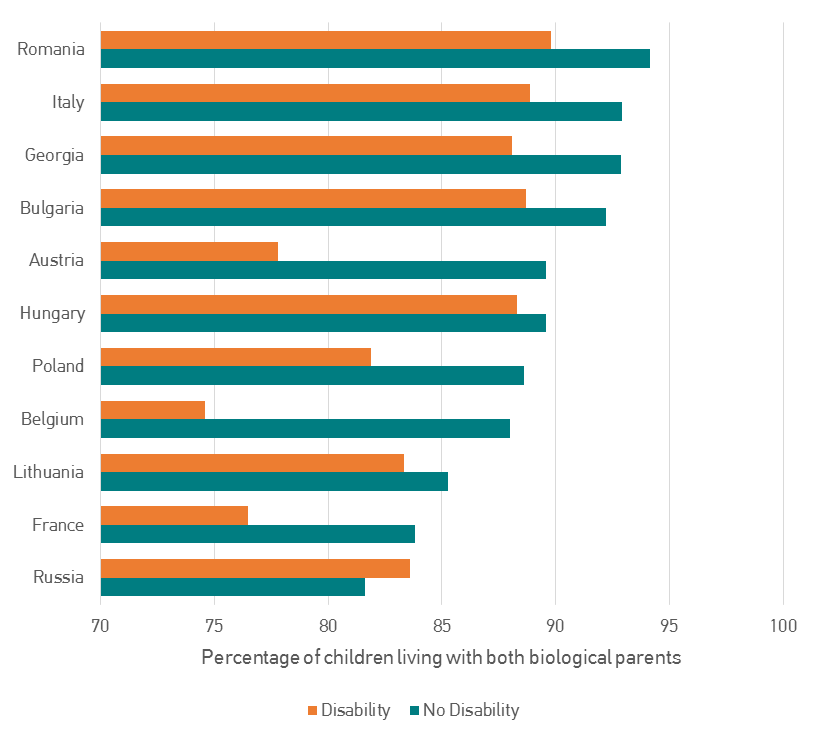
Partnership arrangements for families with disabled children vary across countries in Europe. Analysis of GGP data reveals that disabled children in all countries are more likely to live in a one-parent household (on average 16% of them, as compared with 11% of non disabled children) – with the exception of Russia. Living apart together is also more common among women with disabled children. In addition, analysis of GGP data on partnership histories indicates that among the families with disabled children, almost 2% never had a partner. Among those currently without a partner (11% of the total group) almost all (91%) separated following the birth of the disabled child. Even among the families with both partners in the household, about 6% separated after the birth of the disabled child, which indicates a new union for the respondent. Data from the GGP is vital for understanding how disabilities affect family life and how these effects can be mitigated.
Percentage of children, with & without disability, living with both biological parents, by country
Social mobility is a long standing issue in social research. The GGP offers extensive comparable dataon this topic and a window into the complex dynamics that make up social mobility. In the figure belowwe plot the degree to which a respondent’s father’s education explains his or her own educationaloutcome. The picture it reveals is one of relative stability, in spite of the expansion in higher educationthat most countries have witnessed. This stability is particularly evident in post-socialist countriessuch as Russia, the Czech Republic, Poland and Lithuania where even birth cohorts who undertookthe vast majority of their education after 1989 enjoy relatively high rates of social mobility. However,some countries have shown significant change. In Italy, we can see that an individual’s educationaloutcome has become less dependent on the educational attainment of their father. This is true forboth men and women. Looking forward, new rounds of data collection in the GGP will help update thispicture and understand what the social mobility picture is for millennials and how it is influenced by achanging demographic, social and economic climate.
Social Immobility in 16 Countries by Birth Cohorts
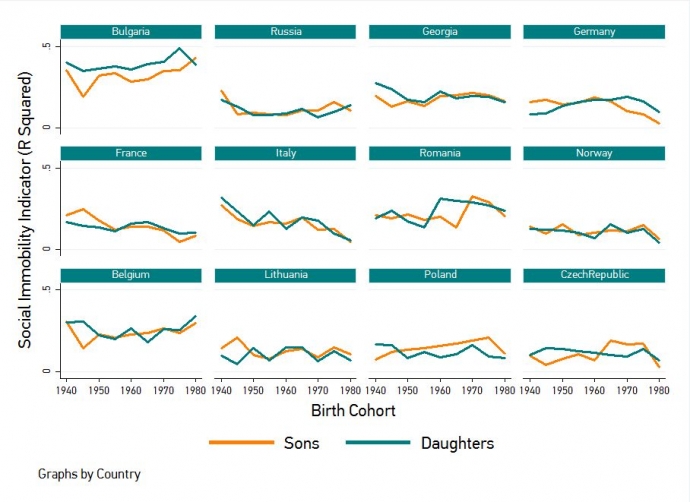
Note: Social mobility is calculated using the R square of an OLS model predicting a respondents’ years ofschooling using their father’s years of schooling. The higher the R square, the more educational attainmentis explained by father’s education. A high score therefore reflects low social mobility and a low scorereflects high social mobility. Data comes from wave 1 of the GGS.
The GGP contain rich data on contraceptive use and reveal stark differences between Eastern and Western European countries. Among partnered individuals age 18-45, the use of traditional contraceptives is higher in Eastern Europe while being close to zero in Western Europe. In contrast, the use of modern contraceptives is much more prevalent in Western Europe. Differences are also observed in the percentage of non-users (here restricted to those not intending to have a child). These differences in contraceptive behavior can be linked to Western Europeans being more ready (i.e. no fertility intentions, high perceived costs of childbearing), willing (i.e. modern family values, not religious), and able (i.e. higher educated, employed, urban residence) to use modern contraceptives as compared to Eastern Europeans. In addition to these individual differentials, prevailing social and cultural expectations concerning fertility, religiosity, and gender equality all help explain differences across countries.
Use of contraception method, by country
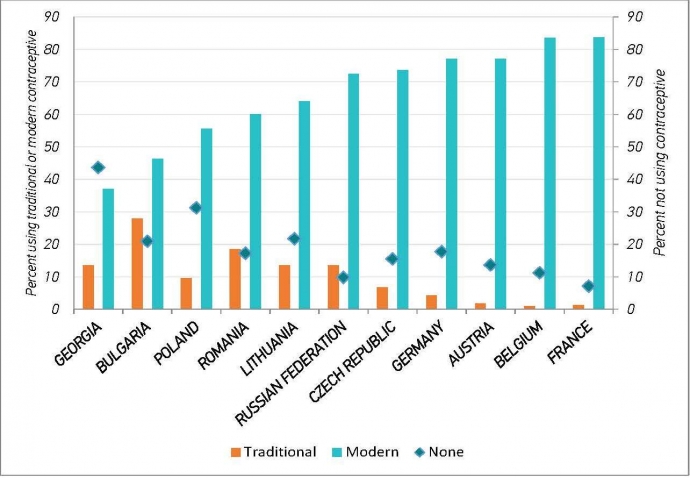
Note: Data: Generations and Gender Survey, Wave 1. The subsample includes 17,492 men and 20,712 women in a heterosexual relationship in which the respondent and his/her partner were between 18 and 45 years. In this analysis, the use of traditional contraception includes withdrawal, the rhythm method, etc. while modern contraception include male condom, the pill, implant, etc. The figures for the non-use refer to the subsample not intending to have a child.Source: Rozemarijn Dereuddre, R., Van de Putte, B. and Bracke, P. (2016). Ready, Willing, and Able: Contraceptive Use Patterns Across Europe. European Journal of Population 32:543–573, DOI 10.1007/ s10680-016-9378-0.
The experience of poverty during childhood is associated with poorer outcomes in terms of a child’s health, education, psycho-social wellbeing and socio-economic attainment in later life. Levels of children living in families struggling to make ends meet financially vary significantly across Europe. Additionally, the percentage of children living in poverty is higher among children living in reconstituted families than children living in biological families. In Central and Eastern Europe, the percentage of children living in reconstituted families that experience financial hardship is between 75% in Lithuania and 95% in Bulgaria. Notably, despite lower percentages of children living in poverty in Western and Northern Europe, there is still a significantly larger percentage of children living in reconstituted families experiencing financial hardship as compared with children living in biological families.
Percentage of Children whose household struggles to make ends meet financially
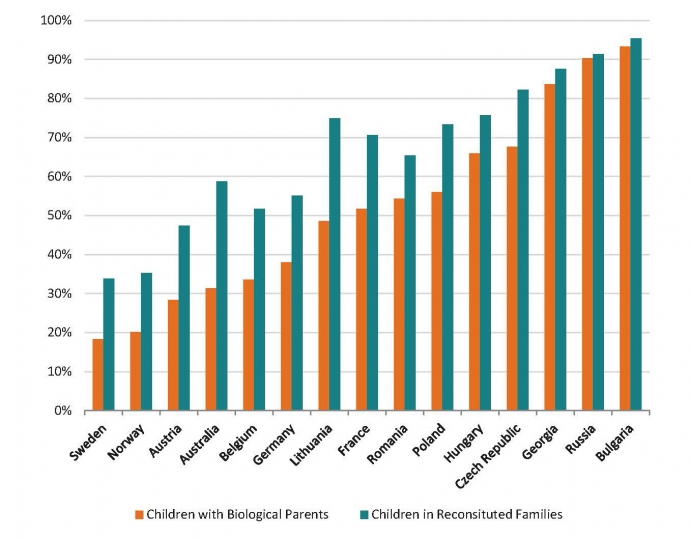
Generations and Gender Survey, Wave 1. Subjective poverty was meausred using variable a1002 and includes families who said they made ends meet with either “Great Difficulty” or “Some Difficulty”. Children in single parent households were excluded from the analysis.
Migration can have profound consequences for family solidarity: when adult children leave the country of origin, ageing parents are deprived of potential care and support. This is especially disruptive in societies where families play an indispensable role in care and welfare provisions, as is the case in Eastern Europe. A comparison of the migrant population to the origin and destination populations gives a hint as to whether migrants adapt to the host country or they preserve their heritage. Figure 1 shows that Poles living in Poland strongly abide by family obligation norms—more than 80% of respondents, regardless of gender, agree that children should take responsibility for caring for their parents when parents are in need. In the Netherlands, the support for this statement was lower—43%, with females showing less support than males. In comparison, Polish migrants’ support for filial obligation is more in line with what is observed in Poland, although it is slightly lower (72%, no gender difference). This result could point towards a selection effect, with less traditional individuals being more likely to leave the country. Nevertheless, Polish migrants seem to maintain the traditional model of family ties existing in Poland.
Support for filial norms in the Netherlands, Poland and amongst Poles in the Netherlands
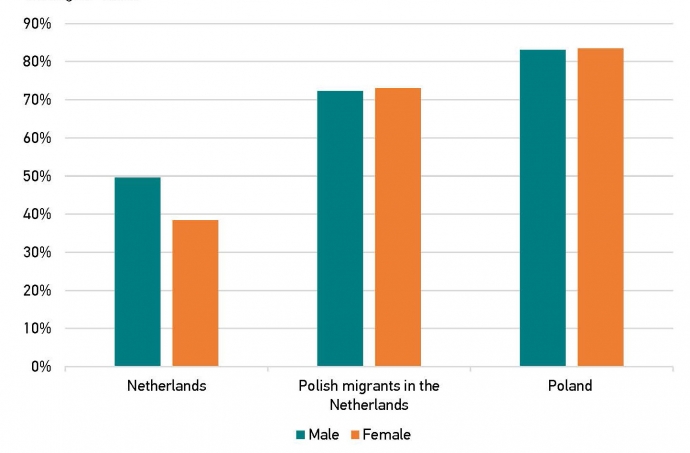
Generations and Gender Survey, Wave 1 for the Netherlands and Poland, FPN study for Polish migrants, Wave 1 for Polish migrants in the Netherlands. Note: Population aged 18-59 years old who either agree or strongly agree with the statement that “Children should take responsibility for caring for their parents when parents are in need”