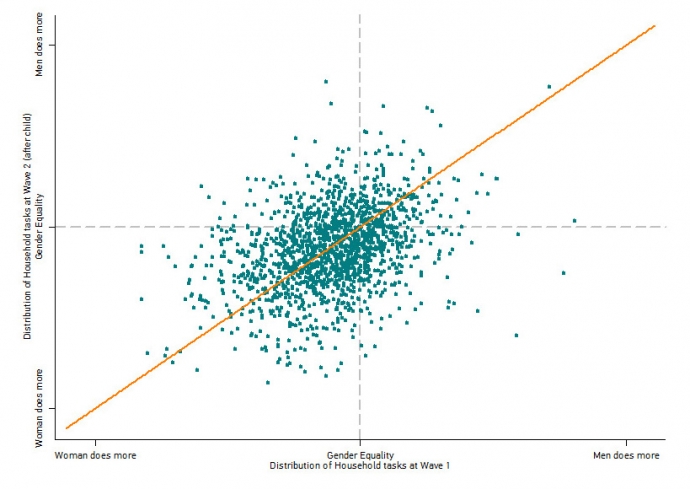
The GGP’s longitudinal design allows researchers to examine how relationships change over time and in response to people’s changing lives. For example, we can examine how the birth of a first child affects the distribution of household work (excluding childcare) within a couple. From the graph below we can see that the majority of couples are to the left of the graph, showing that women do more of the housework even before the arrival of children. At wave 2 these couples, who have all had a child, are primarily still below the gender equality line. The orange line in the graph represents the point at which the distribution of household tasks is the same before and after the arrival of child. Interestingly, there are a roughly equal number of couples on either side of the line. This means that for some couples the distribution of household tasks becomes more gender unequal where in others, it becomes more gender equal. The GGS allows us to probe further and examine what types of couples are in the first group and what type of couples are in the latter.
Distribution of Household Tasks before and after the birth of a couples first child